Stack up against Divvy

Compare Your Deck

Divvy's 2017 Pitch Deck

Fintech
Stage: Series A
Raised: $10.5M
Year: 2017
Slides: 14
Outcome: Acquired by Bill.com for $2.5B

Pitch Deck

1 / 14
Slide 1
Click to expand

Deck Analysis

This deck from Divvy (Series A, 2017) presents a focused fintech play: enable homeownership for credit-worthy renters through a fractional equity model that aligns incentives between the company and tenants. The presentation is notable for its clarity — a tight problem statement, a simple three-step solution, clear tech and capital strategies, and early unit economics and traction metrics — and for how it packages a complex financial product into a consumer-facing, scalable offering. The story here is both product (fractional homeownership) and operations (credit facility + tech platform) — a useful case study for startups bridging regulated finance and consumer marketplaces.

The Opening: Clear mission and positioning

The Opening: Clear mission and positioning

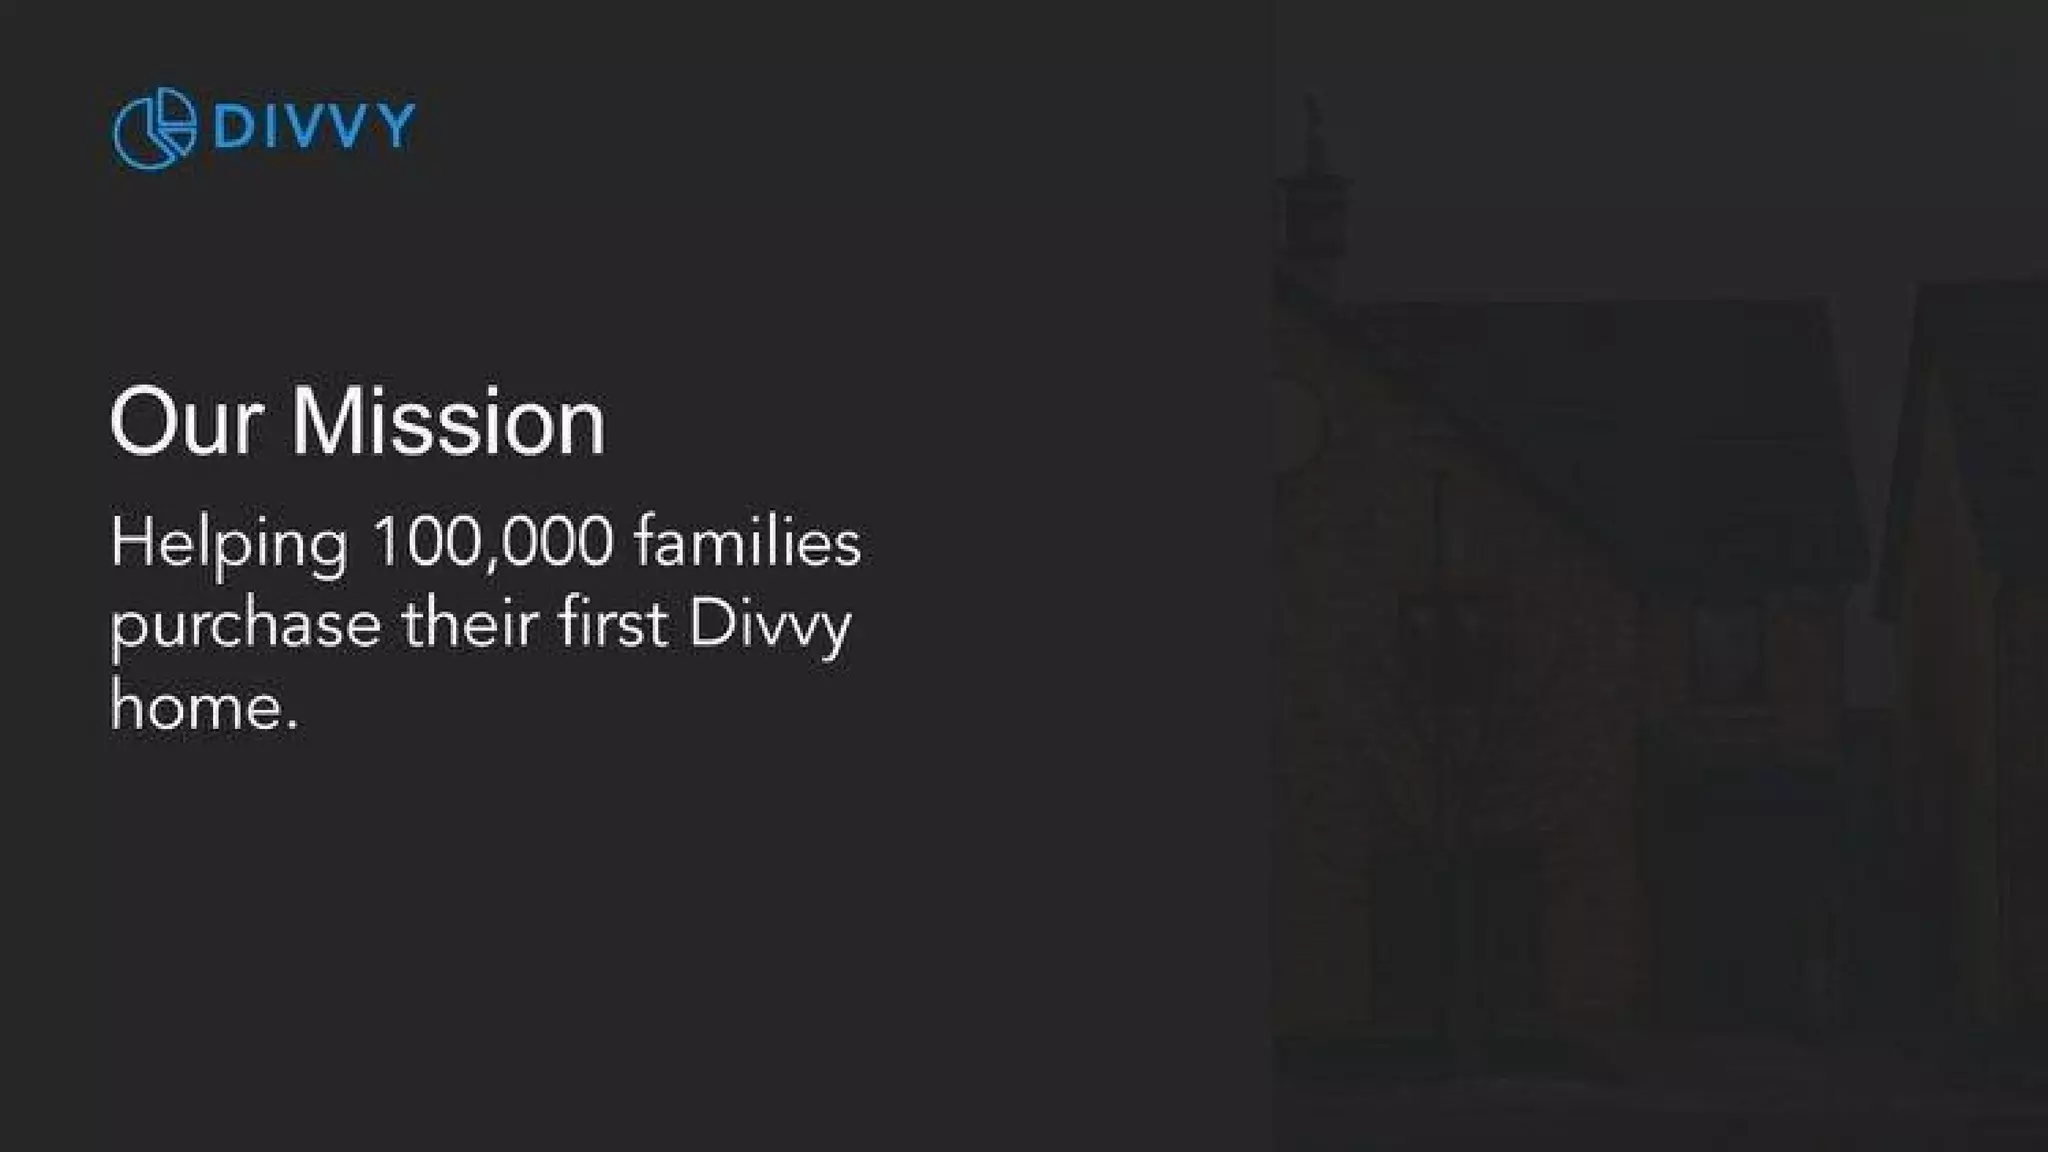
Slide 1 uses minimal copy and strong negative space to introduce the company and its mission: "Access to home ownership. For everyone." The slide is visually spare — a brand mark, the tagline and a date — which forces the audience to focus on the promise and sets the tone for a mission-driven pitch. That economy of language makes the problem immediate and emotionally resonant without burying the audience in data up front.

For founders, this is a reminder that the first slide should do one job well: make the audience remember what you are trying to change. A short, bold mission line backed by a recognizable name/logo and a timestamp is an efficient opener for an investor deck because it frames everything that follows and provides context for traction and financial asks.

Key Takeaway: Lead with a single, memorable mission statement and avoid clutter on your opening slide so investors instantly grasp what you are building.
Team: Demonstrating complementary expertise

Team: Demonstrating complementary expertise

Slide 2 presents the founding trio with photos and short bios that highlight complementary domains — product and real estate expertise, capital markets and underwriting experience, and engineering/tech credentials. The slide communicates credibility quickly: each founder brings a piece of the operating puzzle (product, capital strategy, technology) that the business requires. Including prior companies and education signals both domain knowledge and network access.

For investors in complex, regulated markets, team composition matters more than in many consumer apps. Founders should emulate this by succinctly tying each founder’s background to the company’s most important risks (e.g., underwriting, capital sourcing, technology). Short, targeted bullets under each photo do more to build confidence than long paragraphs.

Key Takeaway: Showhow each founder directly mitigates a core business risk — use concise bullets linking background to the company’s key challenges.
Market Opportunity: A tight and tangible target

Market Opportunity: A tight and tangible target

Slide 3 states a crisp market insight: "6 million credit-worthy households should be homeowners, but aren't." This is a focused TAM/SAM-style stat that immediately defines the addressable customer and the problem scope. It’s effective because it balances specificity (a numeric claim) with empathy (these are credit-worthy people who are being underserved), which helps justify the venture’s mission while hinting at scale.

Founders should aim for single-line market punches like this: concrete, defensible, and directly tied to the product’s value proposition. When possible, follow up with segmentation (who within that 6M is the early target) and how the model captures that subset — investors want to see both size and a credible plan to reach it.

Key Takeaway: Use one clear, defensible market statistic to anchor your opportunity and then show how your initial go-to-market targets a realistic slice of it.
Solution & Business Model: Simple process, aligned incentives

Solution & Business Model: Simple process, aligned incentives

Slide 4 lays out Divvy’s three-step solution: tenant selects a home, Divvy purchases it, tenant buys out equity over time. The slide pairs a simple diagram (debt vs equity ownership) with numbered steps, making a potentially complex financial flow easy to understand. It also highlights the core behavioral and economic insight: sharing equity aligns incentives and creates a pathway to homeownership rather than an opaque loan product.

This approach is instructive: complex financial products benefit from process-driven visuals that show customer flow and alignment of incentives. Founders should prioritize clarity on who owns what at each stage, how customers progress economically, and why the model reduces risk or increases retention compared with incumbents.

Key Takeaway: Map customer flow in 3–4 clear steps and show how ownership and incentives shift over time to make a financial product intuitive.
Technology & Operations: Identifying the core scalable levers

Technology & Operations: Identifying the core scalable levers

Slide 5 positions technology as central to enabling fractional homeownership, breaking it down into pricing, underwriting and operations. Each pillar maps to a specific scaling problem: pricing optimizes rent and appreciation capture, underwriting makes short-term mortgage-readiness credible, and operations automate offers and closings to reduce friction. By calling these out, the deck signals that Divvy is not just a balance-sheet play but a tech-enabled operations business.

For founders building capital-intensive consumer finance products, this is a good blueprint: identify 3–4 core technical capabilities that convert into operational leverage (better margins, faster throughput, lower defaults). Investors want to know which parts of the stack are proprietary vs. commoditized and how tech reduces cost-to-serve as you scale.

Key Takeaway: Explicitly call out the small set of technical capabilities that drive unit economics and operational scale, and explain how each reduces cost or risk.
Unit Economics: Visualizing the value chain

Unit Economics: Visualizing the value chain

Slide 6 depicts annual unit economics in a cascading bar style (revenue -> home costs -> gross profit -> cost of capital -> net income). The visualization emphasizes that revenue contains both rent and equity upside, and that the company’s gross margin must cover capital and operating costs to produce meaningful net income per home. Presenting economics visually makes it easier for investors to understand where value accrues and where pressure points are (e.g., cost of capital).

Founders should use clear visuals to show per-unit flows and sensitivities — highlight the levers (rent optimization, home selection, capital cost) and the assumptions behind them. Be prepared to follow this with a short sensitivity analysis (e.g., how margins change with house price appreciation or varying advance rates) — that’s often the next question from sophisticated investors.

Key Takeaway: Use a simple waterfall or cascading chart to show where revenue becomes profit and call out the top 2–3 levers that move unit economics materially.
Traction: Growth rate and distribution engine

Traction: Growth rate and distribution engine

Slide 13 (monthly homes closed) shows rapidly increasing monthly closings from Nov '17 through an April run-rate, communicating clear momentum. Slide 12 (distribution) earlier highlights an agent-referral flywheel: agents refer clients and other agents. Together these slides demonstrate both demand (growing closings) and a scalable channel (real estate agents incentivized to refer). The combination is powerful: traction without a repeatable distribution model is fragile; pairing them suggests sustainable growth.

Founders should present traction as both raw growth and as evidence of a repeatable acquisition funnel. Use two slides or a combined narrative: one to show the numbers and momentum, and one to explain the mechanism (partnerships, referral loops, economics per acquisition) that will sustain and scale that growth.

Key Takeaway: Show momentum with clear month-over-month metrics and pair that with the concrete distribution mechanism that explains how you’ll sustain growth.

Conclusion: Key Lessons

Divvy’s deck is a compact example of how to pitch a regulated, capital-intensive fintech: it starts with an emotive, simple mission, establishes credibility through team and a tight market stat, explains the customer flow with a direct three-step solution, and then prioritizes the technical and capital levers required to scale. Its strengths are clarity (visual process maps and waterfalls), alignment of incentives (equity sharing), and the combination of early traction with a logical distribution strategy.

Actionable advice for founders: open with a one-line mission, show a clear problem-size stat, map the end-to-end customer flow in 3–4 steps, call out the 3 core technical/operational capabilities that enable scale, present unit economics as a waterfall so top-line converts to net, and prove product-market fit with both momentum and a repeatable acquisition channel. Finally, when your business depends on external capital, explicitly outline how you will source and scale that capital (term loans, credit facilities, partners) — investors want to see a plan for the balance sheet as well as the product.